
Reliability · Editable reference architecture
OpenTelemetry architecture
An editable opentelemetry architecture reference showing Instrumented services → OTel collector → Metrics backend. Control telemetry volume and sensitive attributes.
Open & Edit in DrawArc (Free, No Login Required)Your changes stay in a separate draft on this browser. Download an editable project to keep a portable copy.
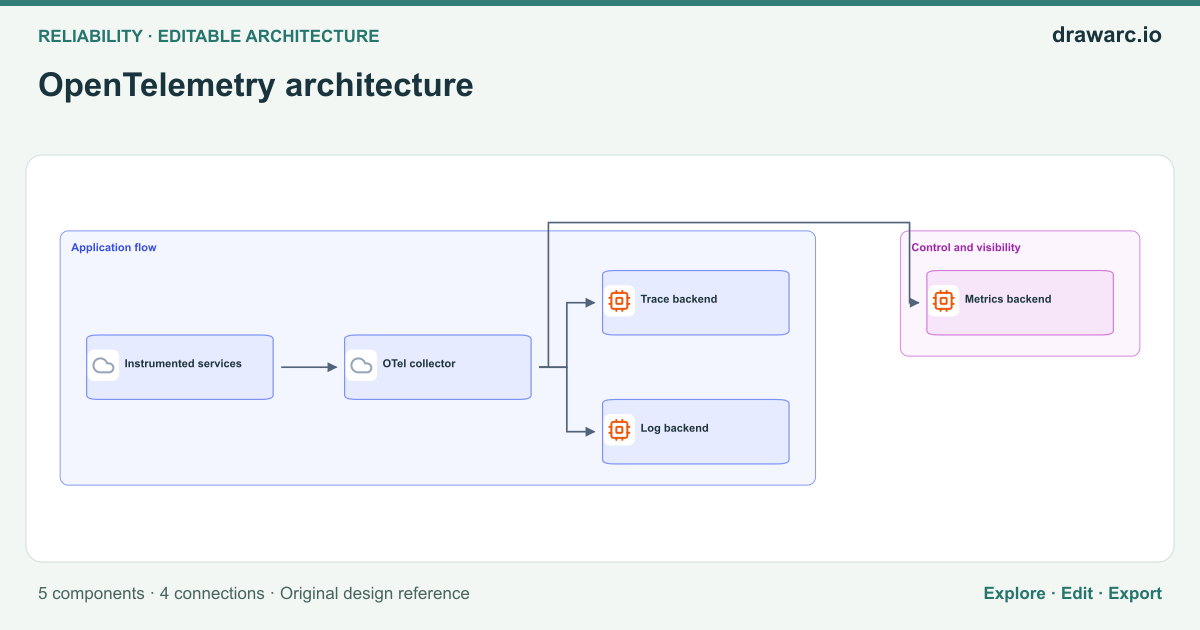
5 components · 4 connections · Open the editor to zoom, move nodes and edit source.
Architectural overview
OpenTelemetry architecture addresses the responsibilities and boundaries shown in this reference rather than prescribing an entire production deployment. The primary flow starts at Instrumented services and reaches Metrics backend through OTel collector. Use this view to explain which component initiates work, which component owns a decision, and where a dependency can affect the caller. Control telemetry volume and sensitive attributes.
The diagram contains 5 distinct components and 4 directed relationships. A separate path connects OTel collector → Trace backend. A separate path connects OTel collector → Log backend. These arrows describe logical interactions; they do not establish authentication, network access, atomic transactions or delivery guarantees. Label the actual protocol, payload contract and owner when adapting the drawing to your system. Keep synchronous and asynchronous boundaries explicit so that a reviewer can identify where a request ends and a later operation begins.
Before implementing this architecture, define expected load, data classification, latency budgets and recovery objectives. Give Instrumented services a bounded dependency timeout and a documented failure response. Assign ownership to any state or external service added during implementation. Validate the decision above against your workload instead of treating the presence of a component as proof of reliability. Open the editable canvas, replace generic labels with real deployment units, and document the decisions that differ from this reference.
The real-world problem
Design or explain opentelemetry architecture with explicit ownership and dependency paths. Control telemetry volume and sensitive attributes.
Data flow
Connections from this diagram. Branches and control signals are not a single chronological sequence.
- Instrumented services → OTel collector. Define the interaction contract and trace the resulting response or state change.
- OTel collector → Metrics backend. Define the interaction contract and trace the resulting response or state change.
- OTel collector → Trace backend. Define the interaction contract and trace the resulting response or state change.
- OTel collector → Log backend. Define the interaction contract and trace the resulting response or state change.
Security boundaries
- Authenticate callers at the boundary before OTel collector accepts protected work; authorize the specific operation rather than trusting network placement.
- Use separate service identities and least-privilege permissions for OTel collector, Metrics backend, Trace backend. Encrypt sensitive traffic, protect credentials and avoid placing confidential payloads in logs.
- Validate untrusted inputs and restrict administrative/configuration endpoints separately from the main flow.
Failure handling
Instrumented services is unavailable or slow
Response: Apply bounded timeouts and controlled backoff only where retrying is safe. Return an explicit failure or durable acceptance; do not report success before required work is committed.
Verify: Interrupt Instrumented services in an isolated test and measure errors, recovery and any repeated side effects.
A dependency repeats or drops a request
Response: Use operation identifiers and explicit acknowledgement/reconciliation where needed. Verify idempotency before enabling retries.
Verify: Exercise the failure path with representative records and verify both the visible response and the resulting state.
An invalid or incompatible input reaches OTel collector
Response: Validate the input contract before effects are committed. Preserve rejected input identifiers without exposing secrets, and document a safe replay or correction procedure.
Verify: Send malformed and older-version inputs through Instrumented services and verify rejection, observability and unchanged valid state.
Trade-offs and alternatives
Control telemetry volume and sensitive attributes.
- Benefit
- Makes the ownership and interaction boundaries visible for a focused design review.
- Cost
- The 5 illustrated components still require contracts, monitoring and operational ownership; extra boundaries can add latency and failure modes.
- Alternative
- Use a simpler deployment when it meets the same requirements, or split a boundary only after measuring a specific need.
Logical boundaries versus deployment units in OpenTelemetry architecture
- Benefit
- Keeps the responsibilities of Instrumented services, OTel collector, Metrics backend visible without requiring a separate server for each box.
- Cost
- A logical view does not establish isolation, independent scaling or high availability; those require a separate deployment design and operational tests.
- Alternative
- Co-locate components in a simpler deployment first when ownership and workload requirements permit it.
When to use this architecture
- Explain opentelemetry architecture to engineers or stakeholders using a concrete visual flow.
- Review this decision before deployment: Control telemetry volume and sensitive attributes.
- Adapt a starting diagram for your own requirements, then record and validate every changed boundary.
Key components
- Instrumented services
- Instrumented services participates in opentelemetry architecture. Instrumented services → OTel collector. Define its contract, owner and access permissions in your implementation.
- OTel collector
- OTel collector participates in opentelemetry architecture. Instrumented services → OTel collector; OTel collector → Metrics backend; OTel collector → Trace backend; OTel collector → Log backend. Define its contract, owner and access permissions in your implementation.
- Metrics backend
- Metrics backend participates in opentelemetry architecture. OTel collector → Metrics backend. Define its contract, owner and access permissions in your implementation.
- Trace backend
- Trace backend participates in opentelemetry architecture. OTel collector → Trace backend. Define its contract, owner and access permissions in your implementation.
- Log backend
- Log backend participates in opentelemetry architecture. OTel collector → Log backend. Define its contract, owner and access permissions in your implementation.
Questions about this template
What does this opentelemetry architecture diagram show?
It shows 5 components with the core flow Instrumented services → OTel collector → Metrics backend. Control telemetry volume and sensitive attributes.
Can I edit this diagram without signing in?
Yes. Open the template in the browser-local canvas to change nodes, connections and source. AI generation and cloud account storage require sign-in.
Is this a complete production implementation?
No. It is an editable reference. Validate the security controls, dependency behavior, capacity and recovery plan against your own requirements before implementation.
Validate your implementation
Use the relevant platform documentation to verify service limits, supported features and configuration. This diagram is an original reference rather than a reproduction of a provider deployment.